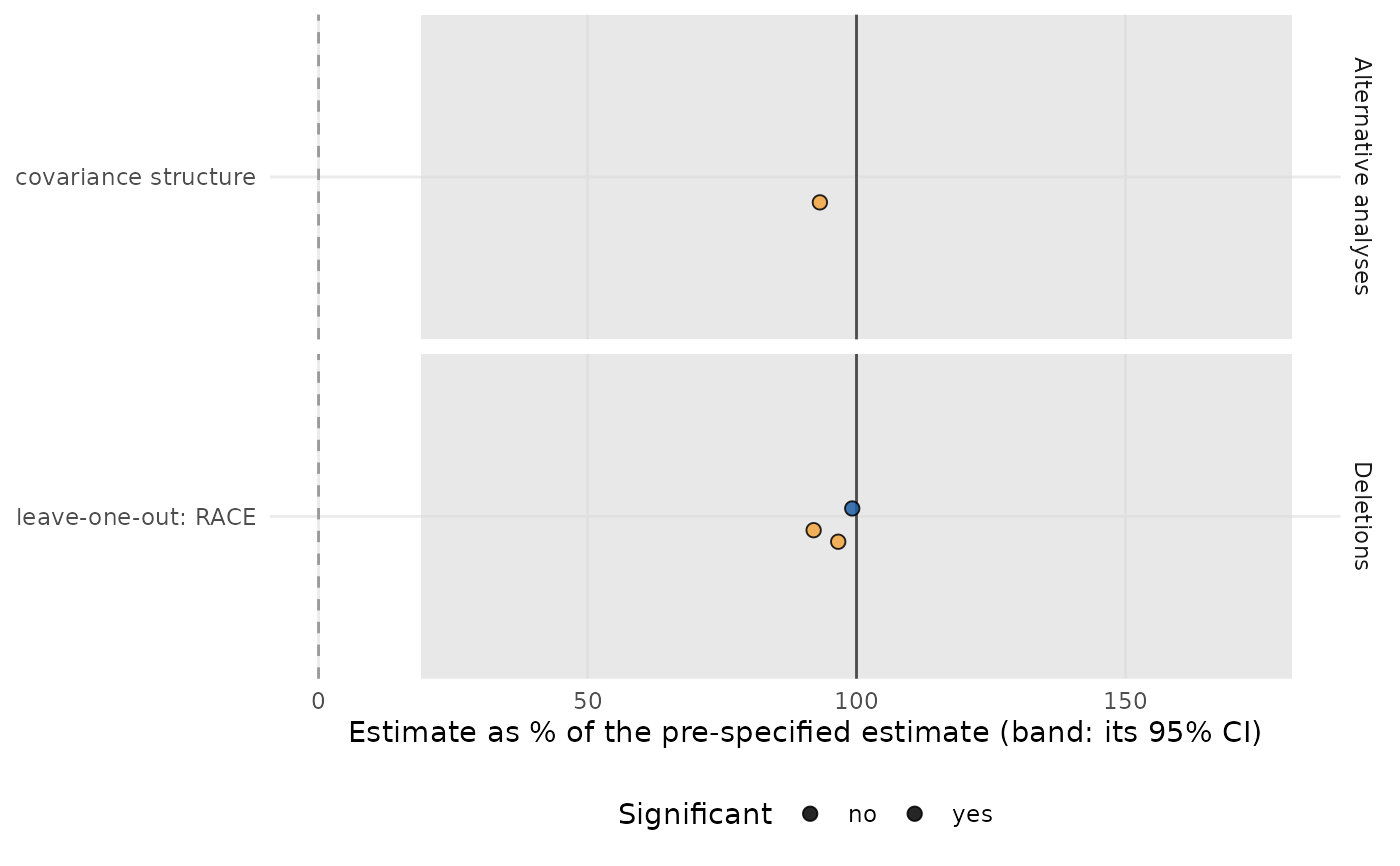
Plot a census: one row per family on the percent-of-base axis
Source:R/plot.R
plot.stress_census.RdEach counted analysis is a point at its estimate as a percent of the base
estimate, filled by significance; the shaded band is the base confidence
interval on the same axis and the vertical line is the base estimate.
Deletions are drawn in a separate panel from alternative analyses.
Diagnostic refits (kind = "diagnostic"), which are fitted but not
counted, are drawn as triangles in the alternative-analyses panel.
Usage
# S3 method for class 'stress_census'
plot(x, ...)Examples
small <- mmrm::fev_data[mmrm::fev_data$USUBJID %in% paste0("PT", 1:80), ]
spec <- stress_spec(small, "FEV1", "USUBJID", "AVISIT", "ARMCD", "PBO", covariates = ~ FEV1_BL,
                    covariance = "cs", method = "Satterthwaite", vcov = "Asymptotic")
cen <- stress_census(spec, stress_covariance(spec, c("cs", "ar1h")),
                     stress_loo(spec, by = "RACE"))
if (requireNamespace("ggplot2", quietly = TRUE)) plot(cen)