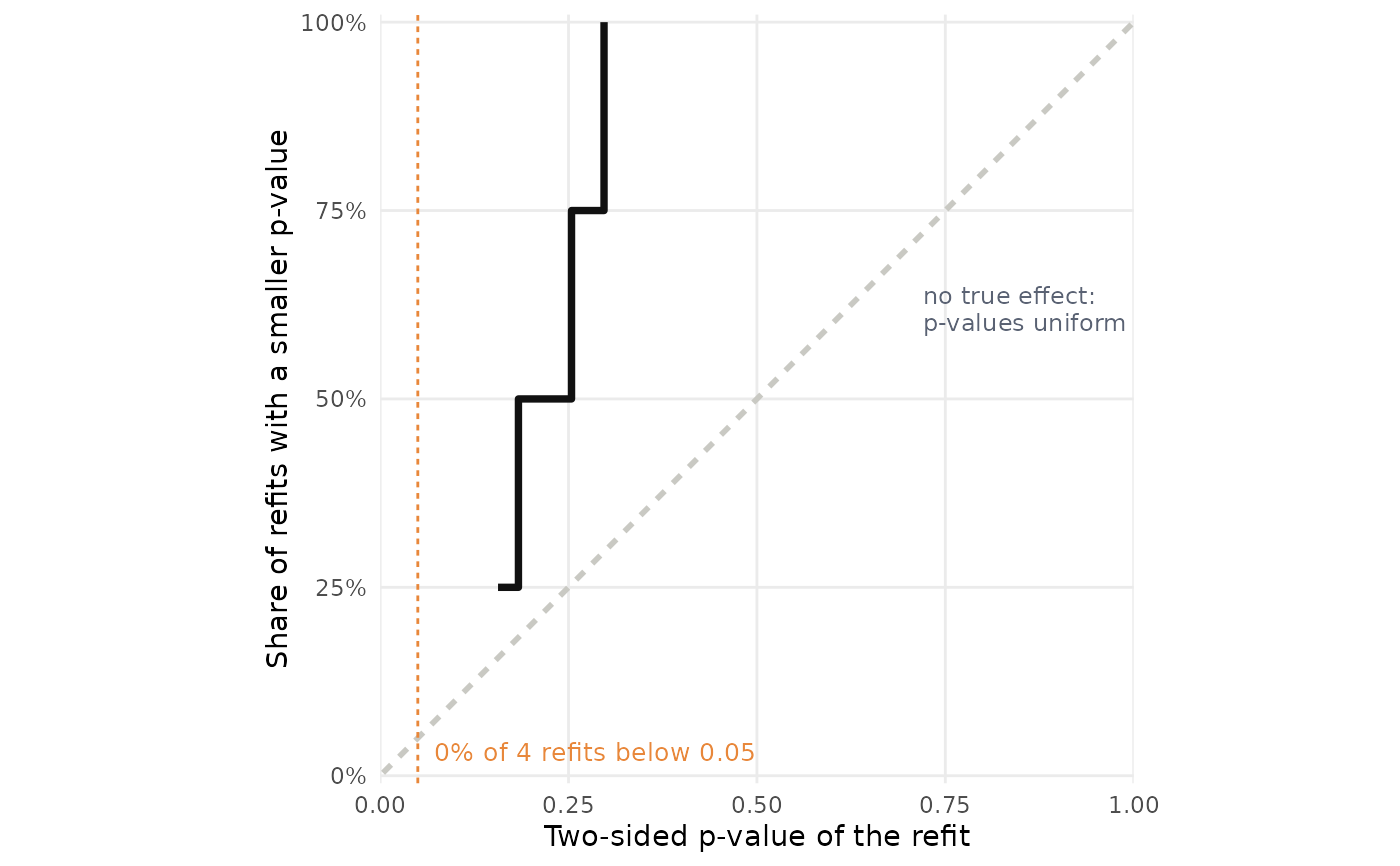
The empirical cumulative distribution of the p-values of every counted refit, against the uniform diagonal that a result with no true effect would produce (the p-value of each refit of a null result is uniform, so the curve of a null census hugs the diagonal; a census far above it is far from random). One curve per census when several are given, with the pooled curve in black; the share below alpha is annotated.
Arguments
- x
A
stress_census, astress_result, the list fromrun_plans(), or a list of censuses or results (one curve each).- alpha
Significance level; defaults to the census's own.
- pooled
Draw the pooled curve over all censuses.
Examples
small <- mmrm::fev_data[mmrm::fev_data$USUBJID %in% paste0("PT", 1:60), ]
spec <- stress_spec(small, "FEV1", "USUBJID", "AVISIT", "ARMCD", "PBO", covariates = ~ FEV1_BL,
                    covariance = "cs", method = "Satterthwaite", vcov = "Asymptotic")
cen <- stress_census(spec, stress_covariance(spec, c("cs", "ar1h")), stress_loo(spec, by = "RACE"))
if (requireNamespace("ggplot2", quietly = TRUE)) plot_pcdf(cen)