
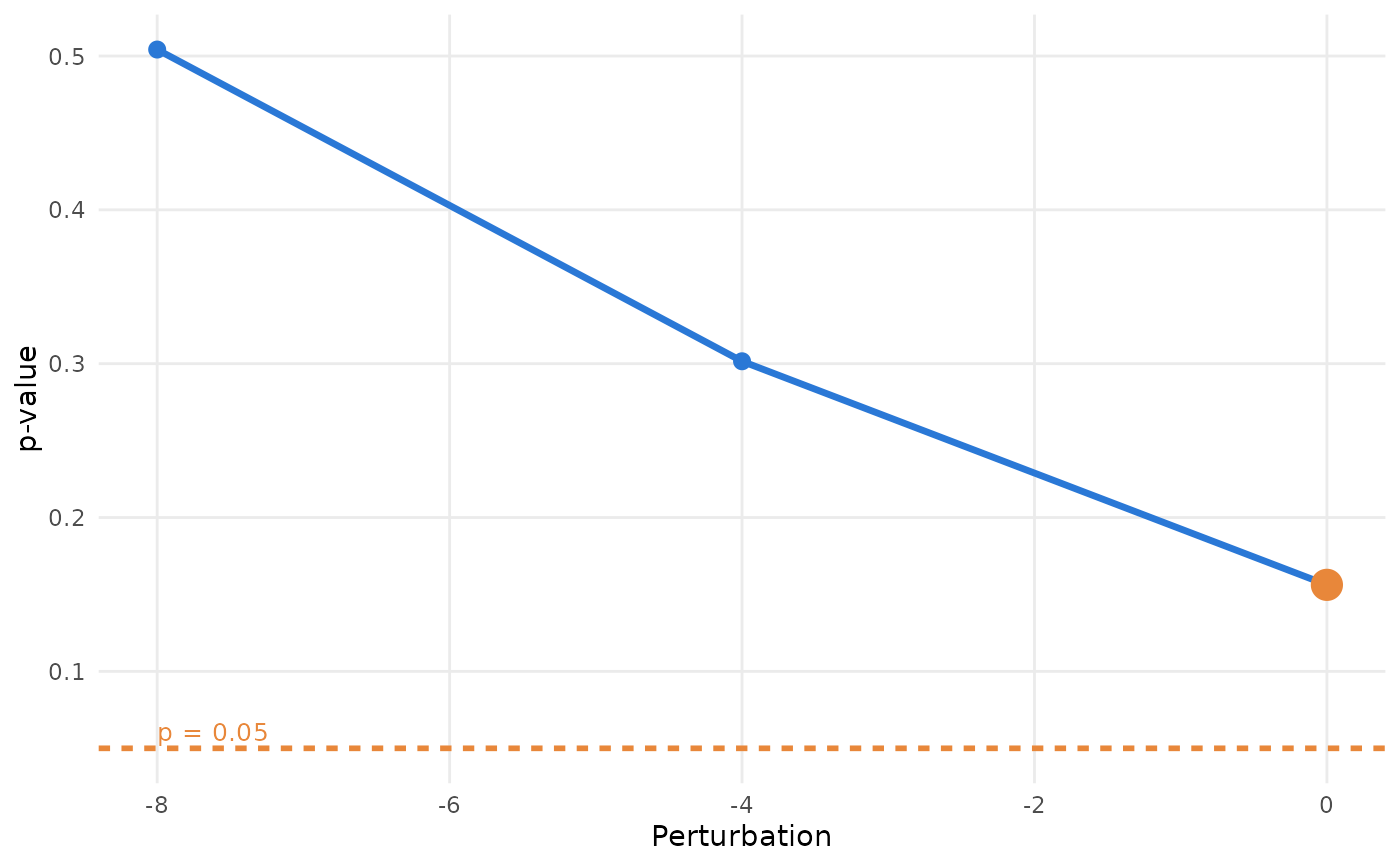
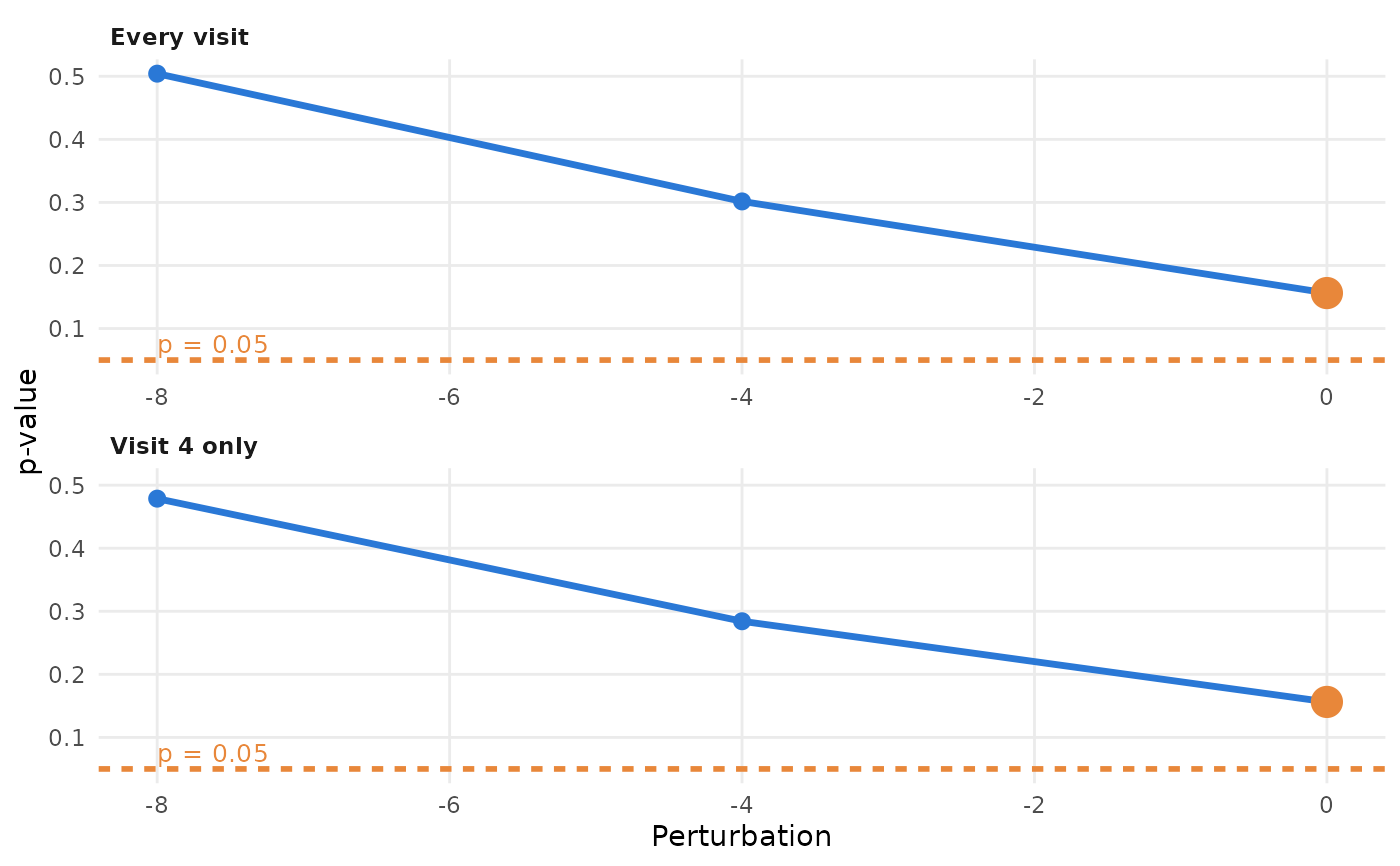
Draws the p-value against the parameter for every family of rows that
carries a param value (from stress_tipping() or stress_curve()): one
line per family, the alpha reference line, the anchor point (the row of
kind = "alternative", usually the unshifted analysis) emphasised, and a
dotted vertical line at each interpolated crossing with its value.
Usage
plot_pcurve(
  rows,
  alpha = NULL,
  xlab = "Perturbation",
  ylab = "p-value",
  log_p = FALSE,
  ncol = 1
)
Arguments
- rows
A
stress_rowsdata frame, astress_censusor astress_result; or a named list of these, one panel each. Rows without aparamare ignored.- alpha
Significance level; defaults to the rows' own
alpha.- xlab, ylab
Axis labels.
- log_p
Draw the p-value axis on a log scale.
- ncol
Number of columns of panels when
rowsis a list.
Details
Given a named list (one element per endpoint-metric row, say), it draws one panel per element, with the crossings found within each panel.
Examples
small <- mmrm::fev_data[mmrm::fev_data$USUBJID %in% paste0("PT", 1:80), ]
spec <- stress_spec(small, "FEV1", "USUBJID", "AVISIT", "ARMCD", "PBO", covariates = ~ FEV1_BL)
tp <- stress_tipping(spec, deltas = c(0, -4, -8), m = 3)
if (requireNamespace("ggplot2", quietly = TRUE)) plot_pcurve(tp)
 # \donttest{
tp4 <- stress_tipping(spec, deltas = c(0, -4, -8), m = 3, shift_visits = "VIS4")
if (requireNamespace("ggplot2", quietly = TRUE)) {
plot_pcurve(list("Every visit" = tp, "Visit 4 only" = tp4))
}
 # }