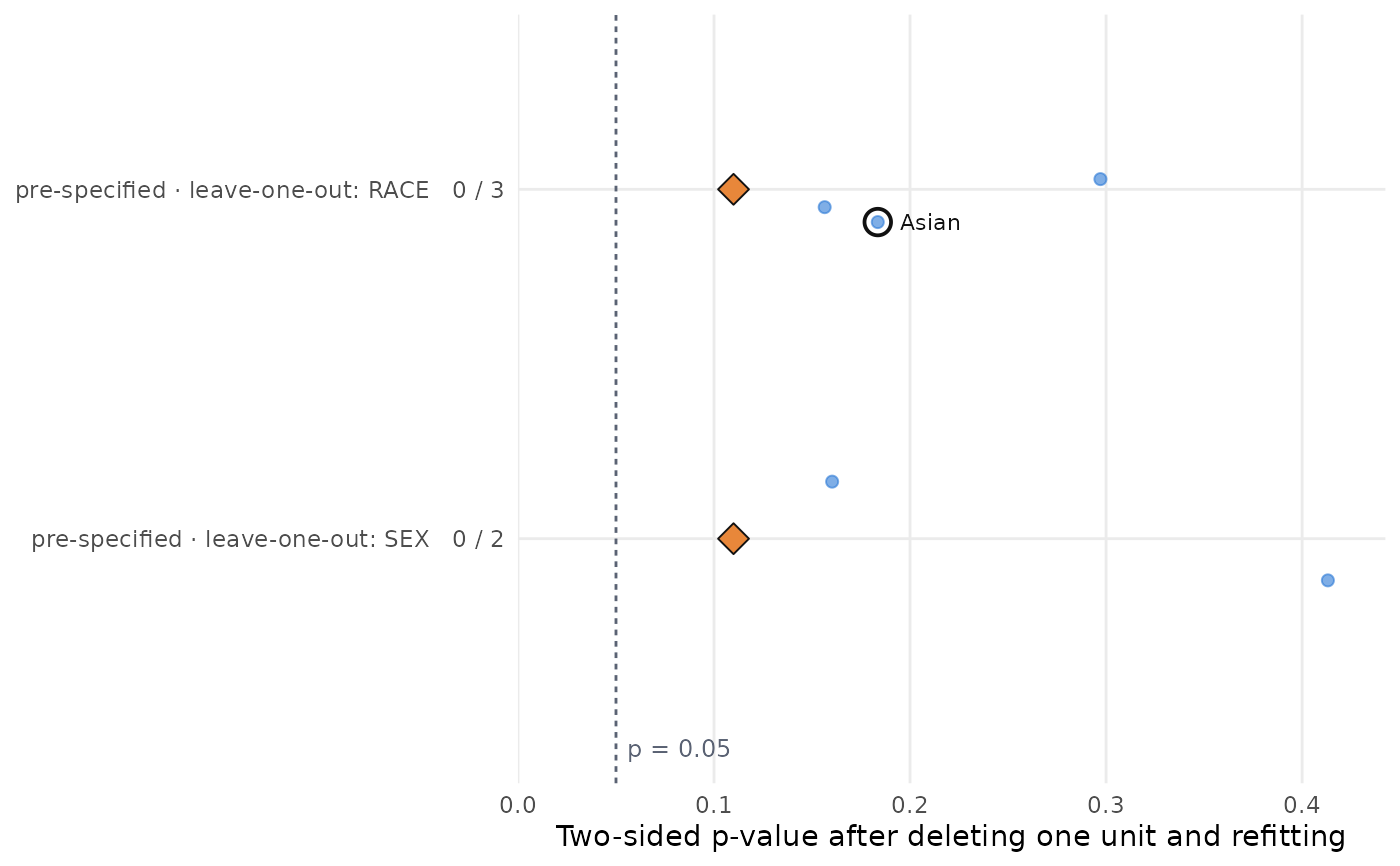
Each dot is one refit with one unit removed, on a p-value axis (linear by default, log on request), one strip per leave-one-out family; the diamond is the pre-specified analysis with nothing removed and the dashed line is alpha. Counts of deletions below alpha label each strip.
Usage
plot_pstrip(
  x,
  alpha = NULL,
  log_p = FALSE,
  xmax = NULL,
  label_family = TRUE,
  highlight = NULL,
  seed = 1L
)
Arguments
- x
A
stress_census, astress_result, or a list of them (one strip each).- alpha
Significance level; defaults to the census's own.
- log_p
Draw the p-value axis on a log scale (spreads out the small p-values; harder to read for most audiences).
- xmax
Upper limit of the linear p-value axis;
NULLfits the data.- label_family
Include the deletion family in each strip label; set
FALSEwhen every census contributes one family (subjects only, say).- highlight
Optional labels of deletion rows (the removed unit, as in the census
labelcolumn) to ring and label, for example the participant whose removal crosses alpha. Usemask_ids()first if identifiers must not appear.- seed
Seed of the vertical scatter within each strip, so the figure is the same every time it is drawn; the caller's random-number state is restored on exit.
Examples
small <- mmrm::fev_data[mmrm::fev_data$USUBJID %in% paste0("PT", 1:60), ]
spec <- stress_spec(small, "FEV1", "USUBJID", "AVISIT", "ARMCD", "PBO", covariates = ~ FEV1_BL,
                    covariance = "cs", method = "Satterthwaite", vcov = "Asymptotic")
cen <- stress_census(spec, stress_loo(spec, by = "RACE"), stress_loo(spec, by = "SEX"))
if (requireNamespace("ggplot2", quietly = TRUE)) {
  plot_pstrip(cen)
  plot_pstrip(cen, highlight = "Asian")
}