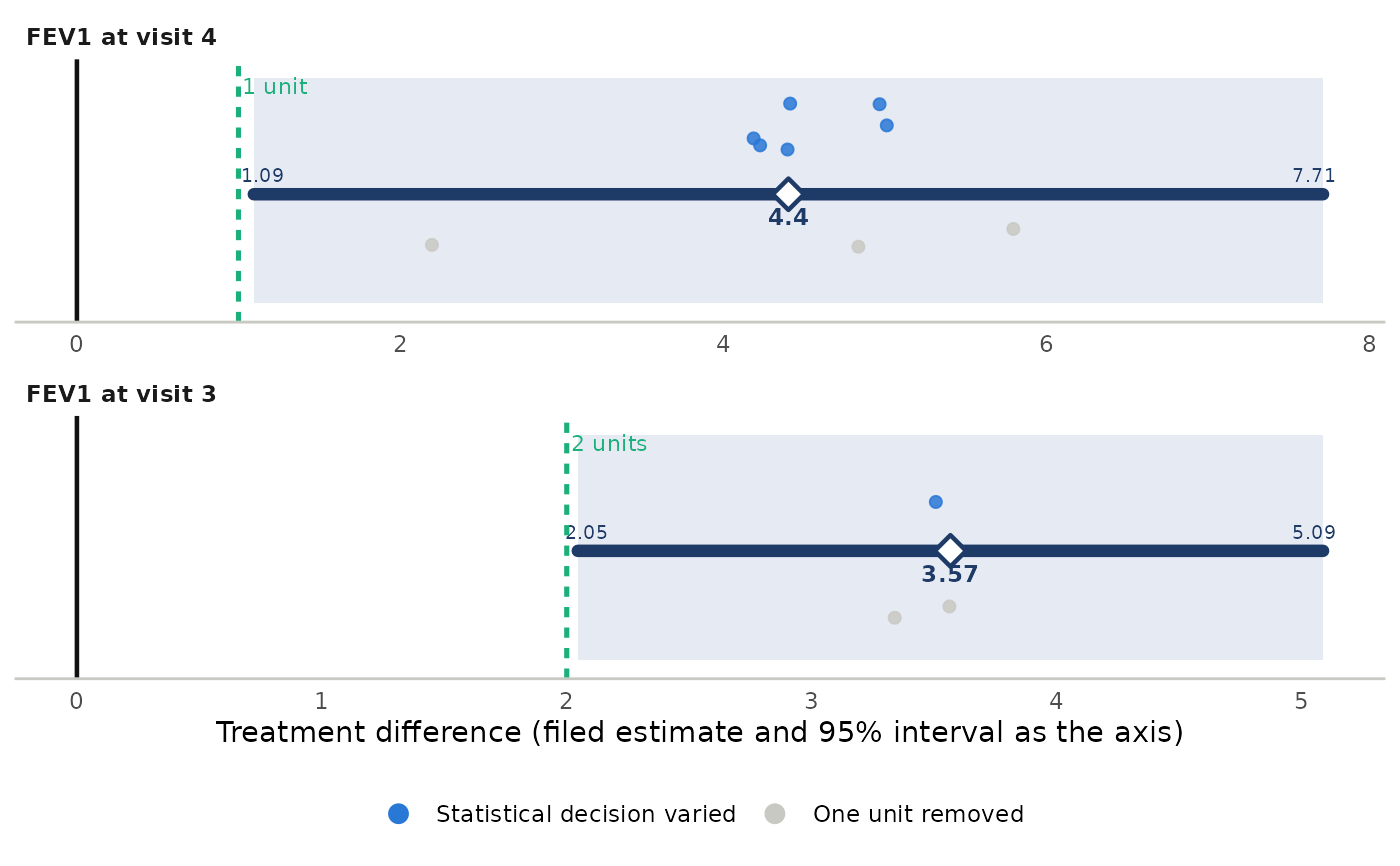
Two forms. Single census (style = "bubbles", the default for one census): the bubble swarm of earlier
versions, one row per census on a percent-of-filed axis. Several rows (style = "dots", the default for a
list): one panel per endpoint-metric row, the filed estimate and its 95% interval drawn as the axis of the
panel with the filed value labelled, every counted alternative analysis as a dot placed by its estimate and
coloured by the decision it varies (statistical: covariance, inference, covariate set, weighting, grid,
estimator; data-handling: data set, population, intercurrent-event strategy, imputation), the counted deletions
as a strip of small light dots beneath the axis, a vertical line at no difference, and optional labelled
reference lines, one value for every panel or one per panel. Each panel labels its own filed estimate and
interval ends to three significant digits. Diagnostic refits (kind = "diagnostic", such as the complete-case refit of the standard plan)
are drawn as hollow dots in the colour of their decision group; they are not counted and do not enter the
verdict. Counted rows that return no estimate (rank tests) are not drawn; their number per row is in
the caption attribute of the returned plot, with the counts of alternatives, deletions and diagnostic refits.
Arguments
- x
A
stress_census, astress_result(fromrun_plan()), thestress_resultslist ofrun_plans(), or a list of censuses or results (one row each). List names, plan titles or census labels name the rows.- style
"bubbles"or"dots";"auto"chooses bubbles for one census and dots for a list.- reference
Optional x position of a reference line (a clinically meaningful difference, say). In the dots form either one value, drawn in every panel, or one value per row: a vector named by row, or unnamed in row order.
NAleaves a panel without a line. Rows on different scales (points and percent change, say) need their own values.- reference_label
Text printed at the reference line: one string, or one per row in the same form as
reference.- scale, digits, r0, favours, xlab, xlim
Settings of the bubble form (see the earlier documentation): axis scale, rounding for "the same value", bubble radius, side labels, axis label and limits.
Value
A ggplot object. In the dots form the attribute caption is a character vector, one entry per
row, with the counts of alternatives drawn, deletions drawn and rows without an estimate.
Examples
spec <- stress_spec(mmrm::fev_data, "FEV1", "USUBJID", "AVISIT", "ARMCD", "PBO",
                    covariates = ~ RACE + SEX + FEV1_BL)
cen <- stress_census(spec, stress_covariance(spec, c("us", "cs", "ar1h")),
                     stress_covariates(spec), stress_loo(spec, by = "RACE"))
if (requireNamespace("ggplot2", quietly = TRUE)) {
  plot_swarm(cen)                                           # one census: bubbles
  spec2 <- stress_spec(mmrm::fev_data, "FEV1", "USUBJID", "AVISIT", "ARMCD", "PBO",
                       covariates = ~ FEV1_BL, contrast_visit = "VIS3")
  cen2 <- stress_census(spec2, stress_covariance(spec2, c("us", "cs")),
                        stress_loo(spec2, by = "SEX"))
  g <- plot_swarm(list("FEV1 at visit 4" = cen, "FEV1 at visit 3" = cen2), reference = 1,
                  reference_label = "1 unit")
  attr(g, "caption")
  plot_swarm(list("FEV1 at visit 4" = cen, "FEV1 at visit 3" = cen2),     # one line per panel
             reference = c("FEV1 at visit 4" = 1, "FEV1 at visit 3" = 2),
             reference_label = c("1 unit", "2 units"))
}